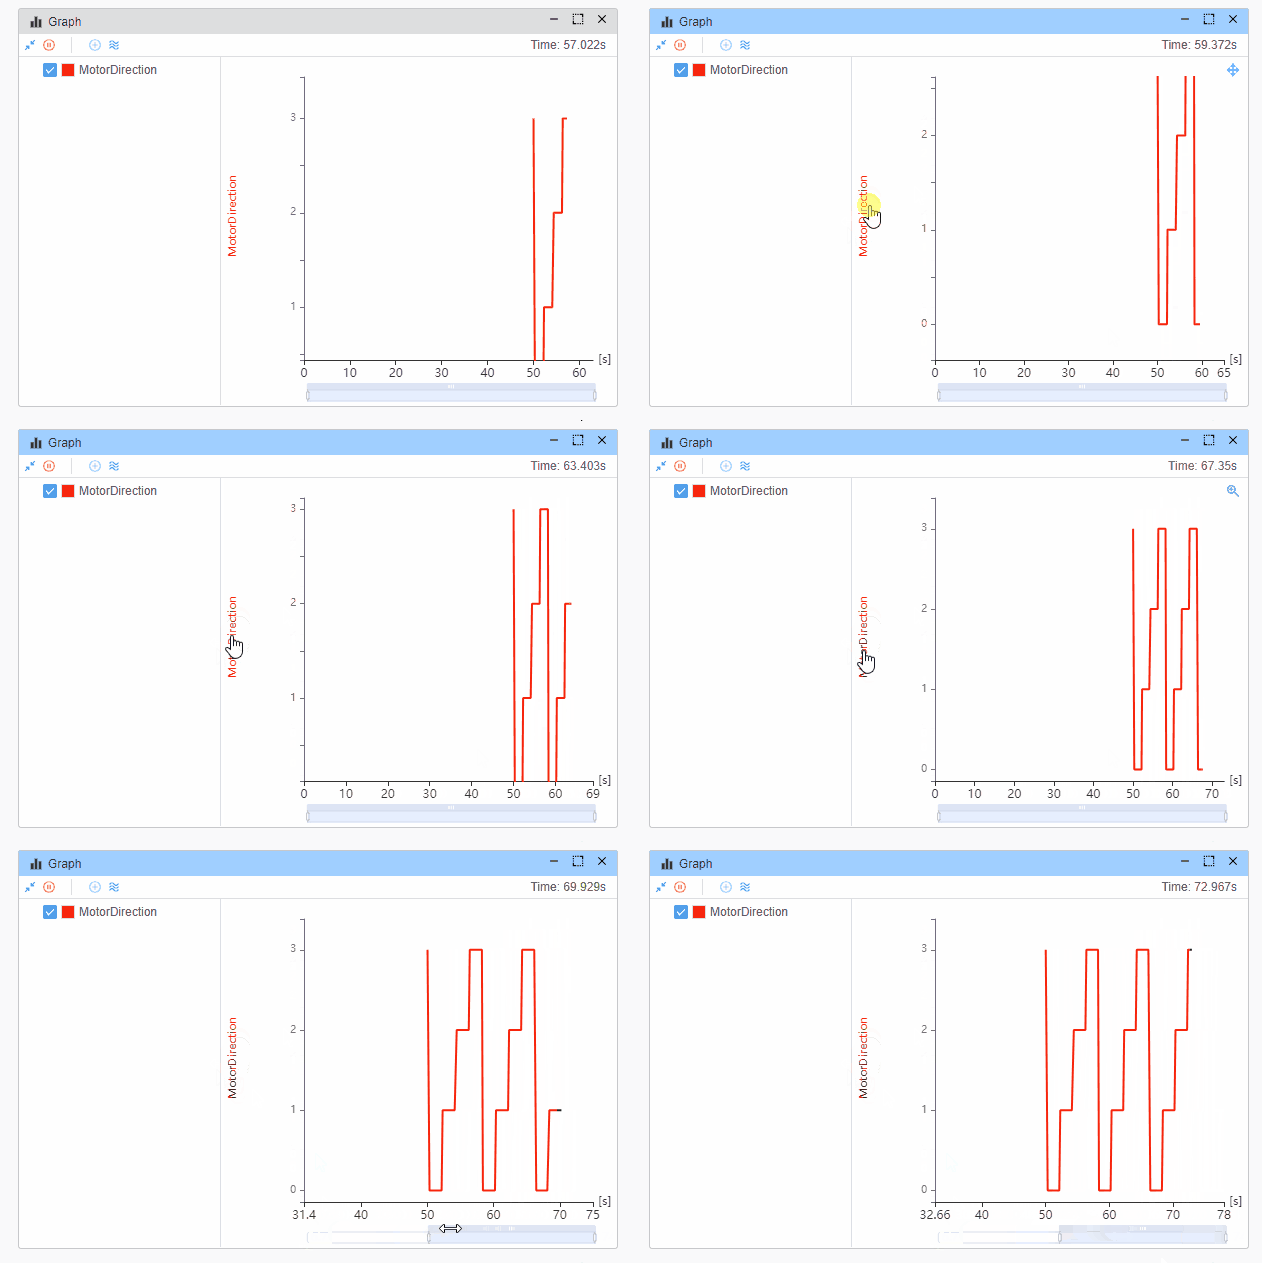
Graph
The graph signal feature allows you to visualize the data flow between signals in a graphical format. This feature is especially useful for understanding the relationship between signals and for debugging complex signal interactions. 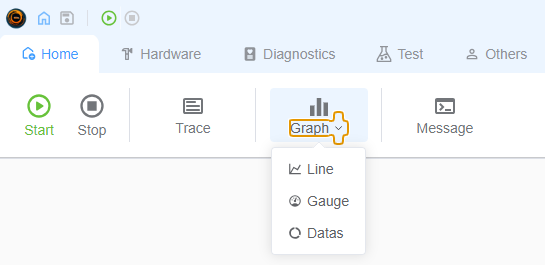
- Line
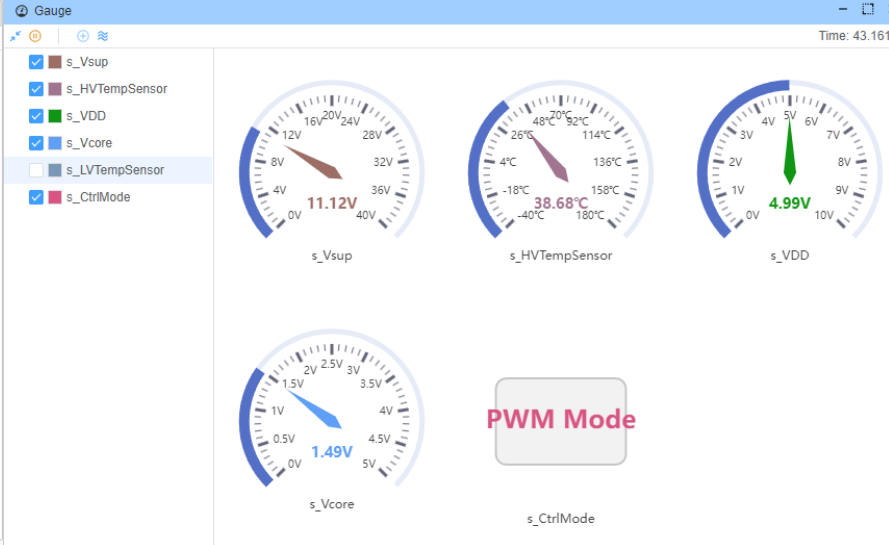
- Gauge
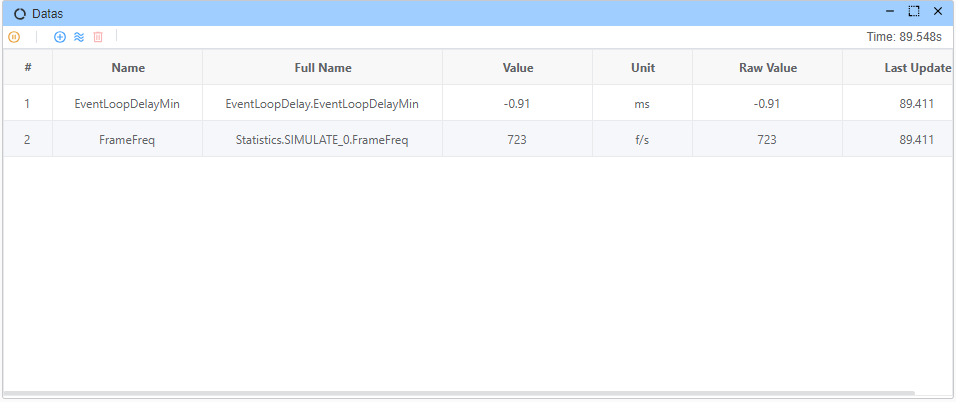
- Data
Adding Signals
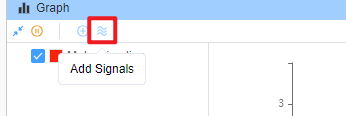
Add signal from database, which depends on database.
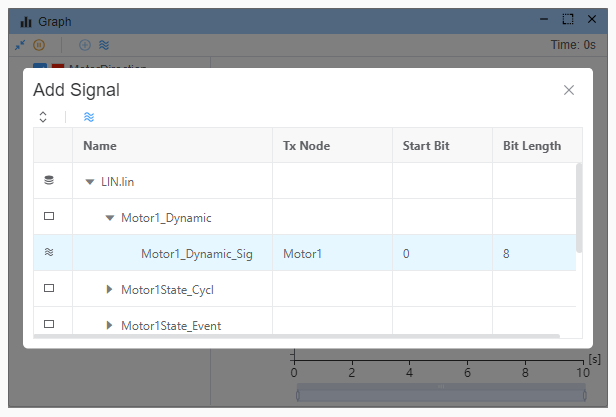
Add Variabls
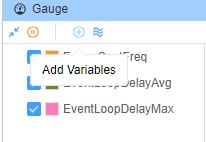
All valid variables from Variable Window.
Multi Signal In One Graph
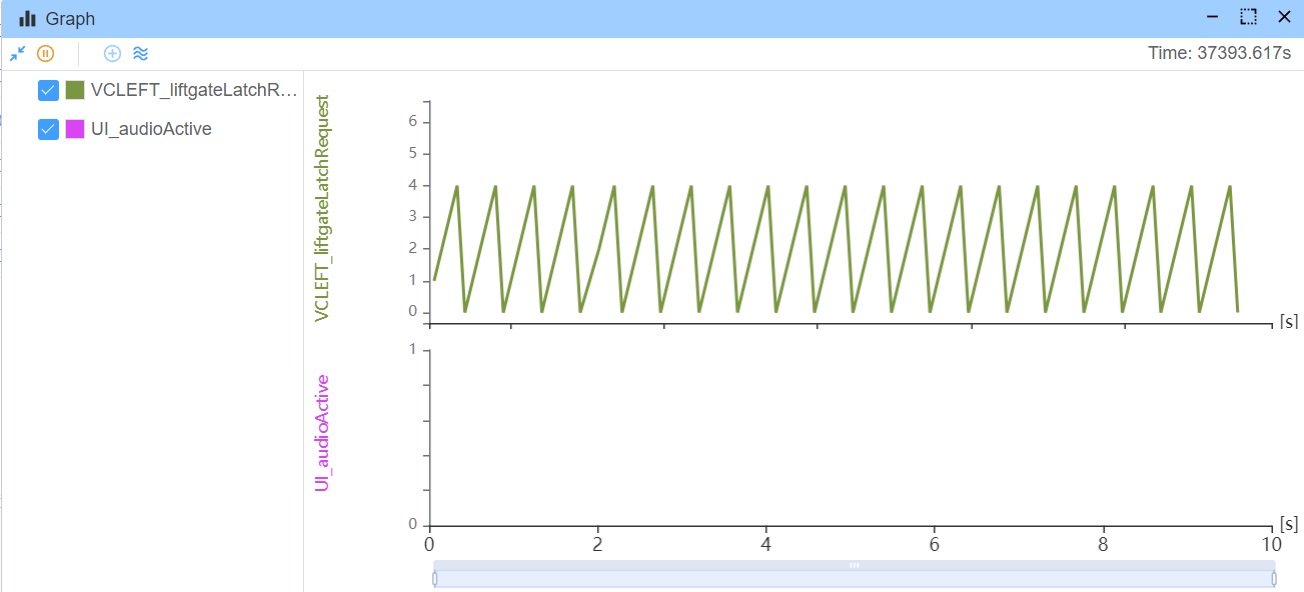
Add multiple signals or variables from the tree, then enable the checkboxes for each item you want to plot. All enabled traces are drawn on the same timeline and share the X (time) axis. Each trace keeps its own color and appears in the chart legend so you can distinguish overlapping series.
Use the tree checkboxes to add or remove variables from the timeline without creating a separate graph window for each signal. With a single enabled item, the graph behaves the same as before (one series with that signal's Y-axis settings).
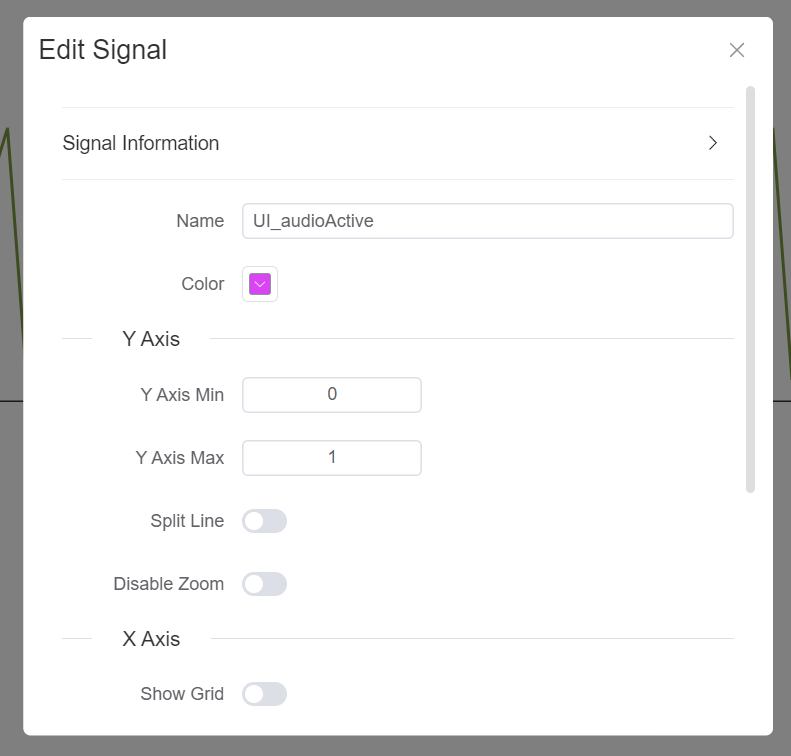
Edit Signal Property
Drag/Zoom Line Graph
You you zoom in/out the graph by dragging the mouse wheel.